


AI Analytics • Trends • Social Media
.avif)


(Concept w/ Client) POS System • Shipping • Production
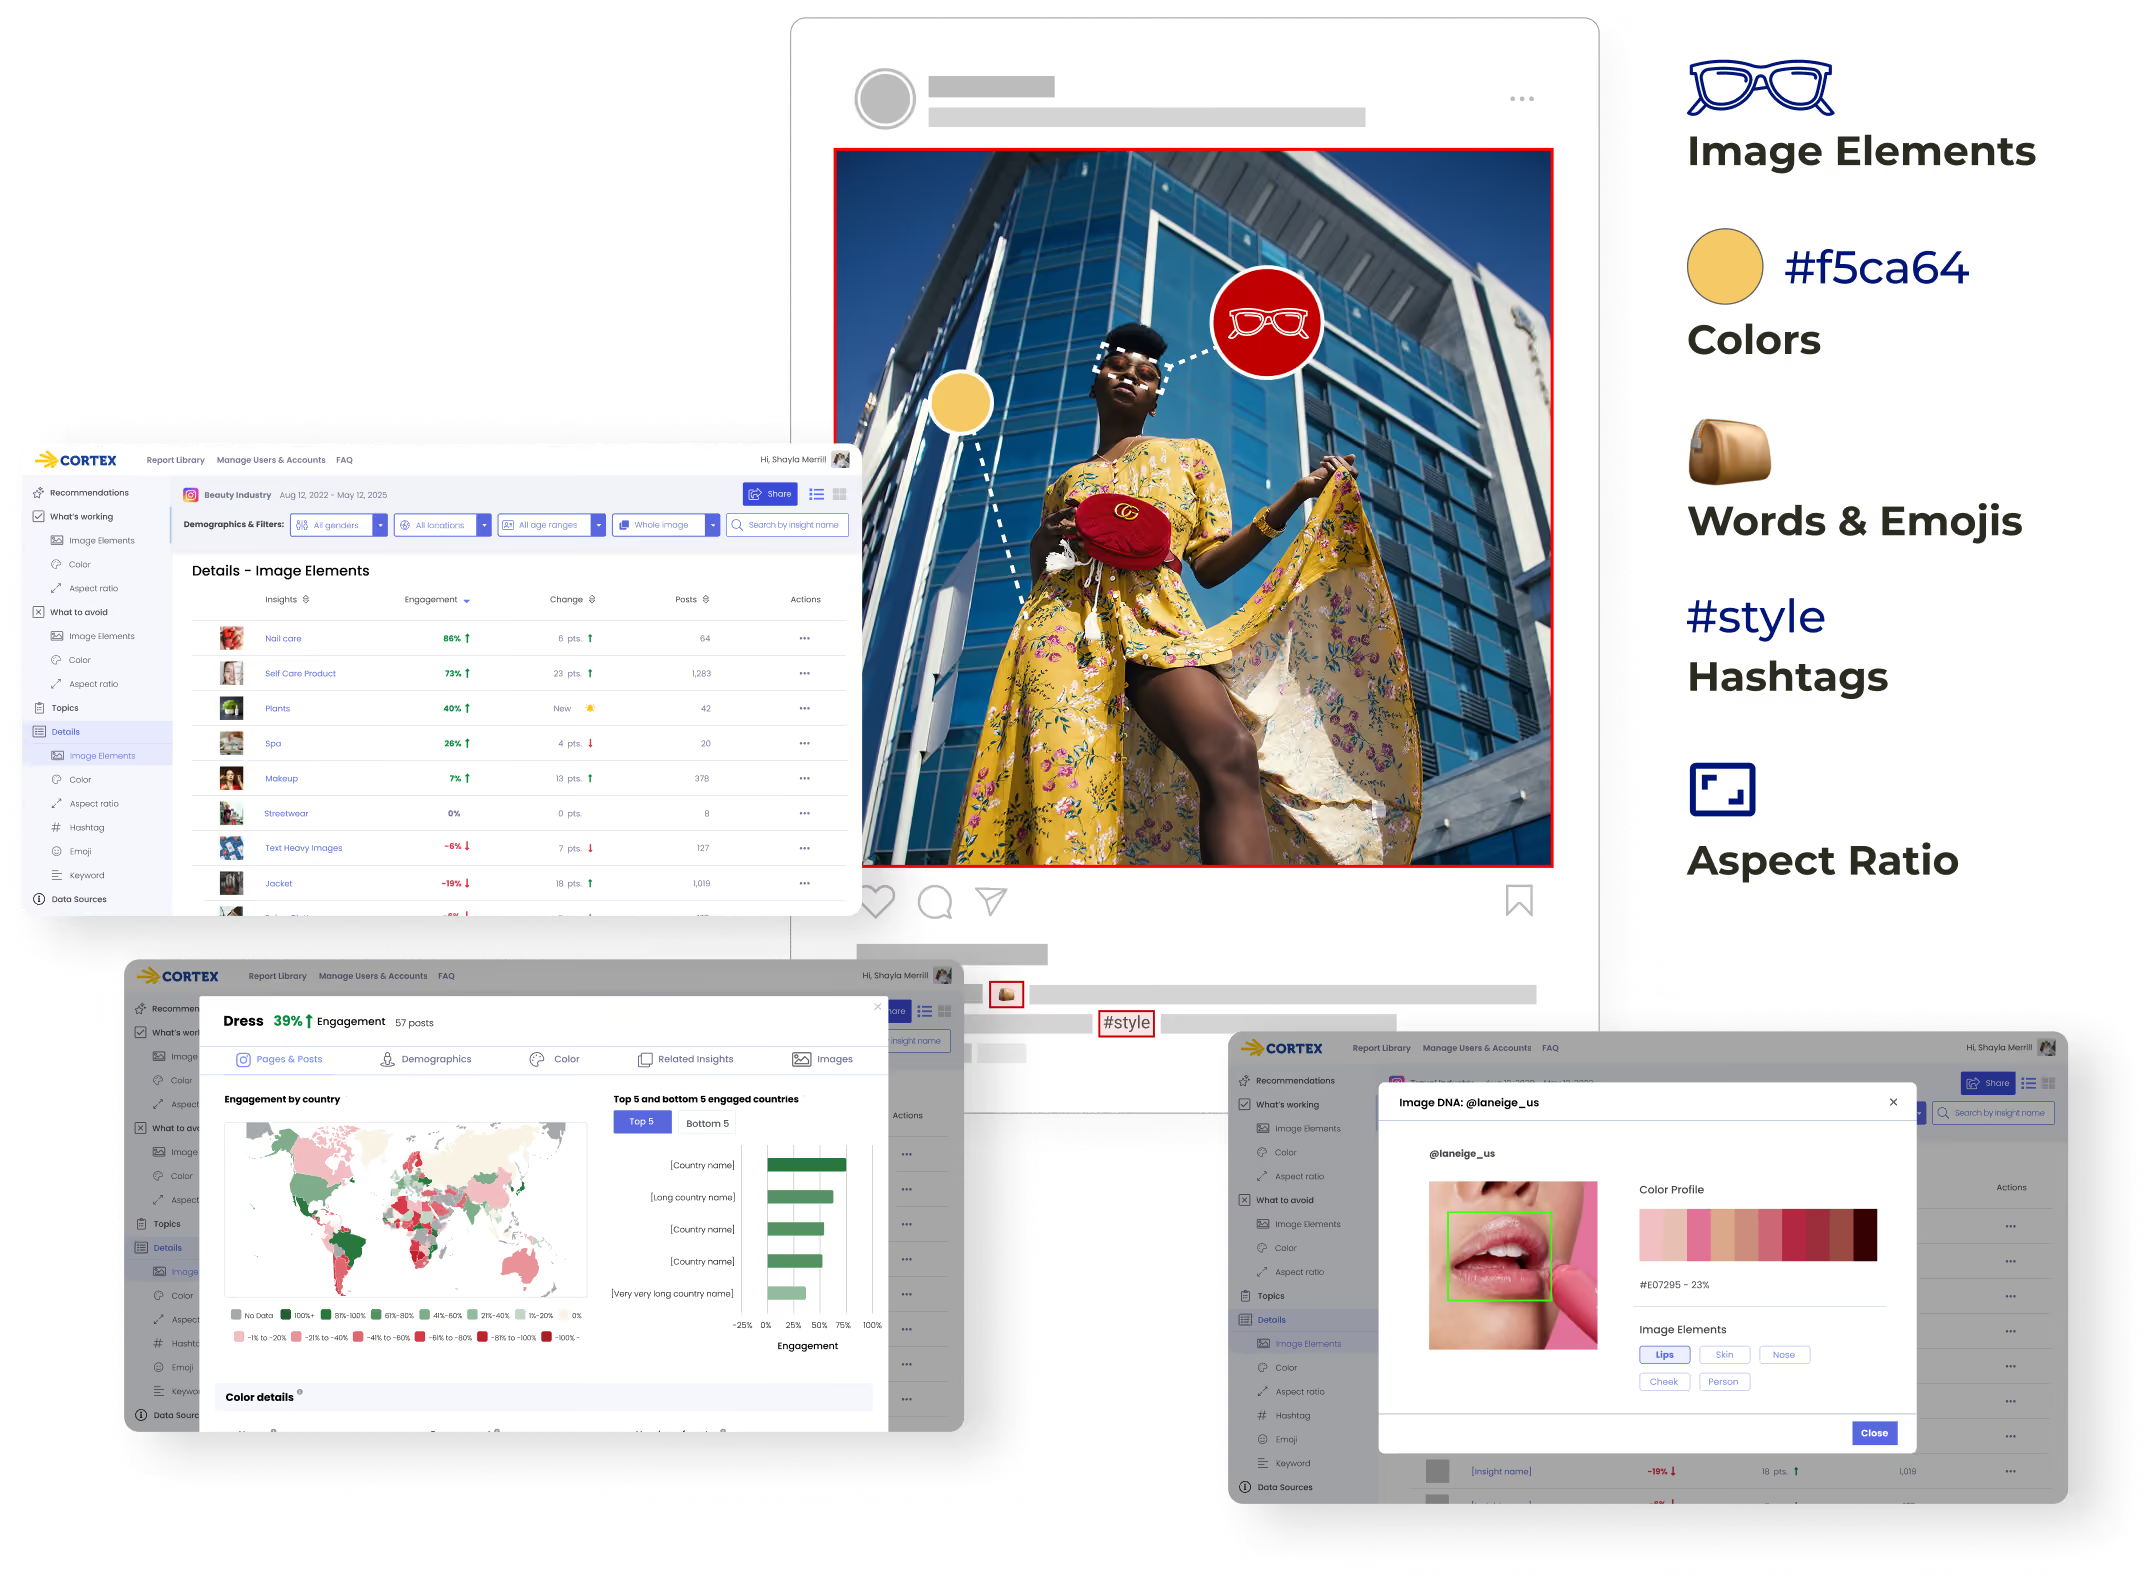
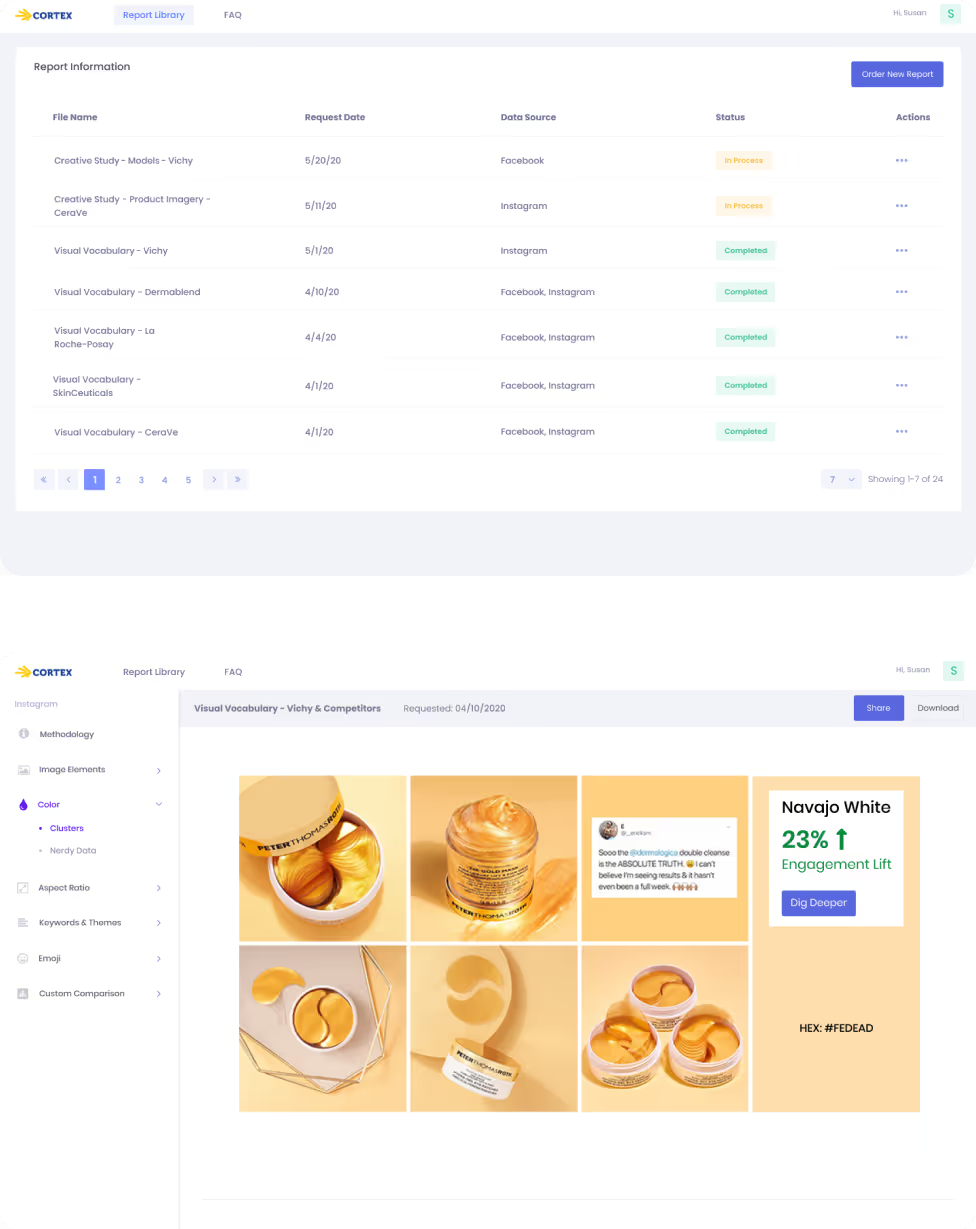
Cortex is an Al-driven SaaS platform.
It helps creatives build a stronger online presence across all major social media platforms such as: Instagram, Facebook, X/Twitter, TikTok, Youtube, LinkedIn, & Pinterest.
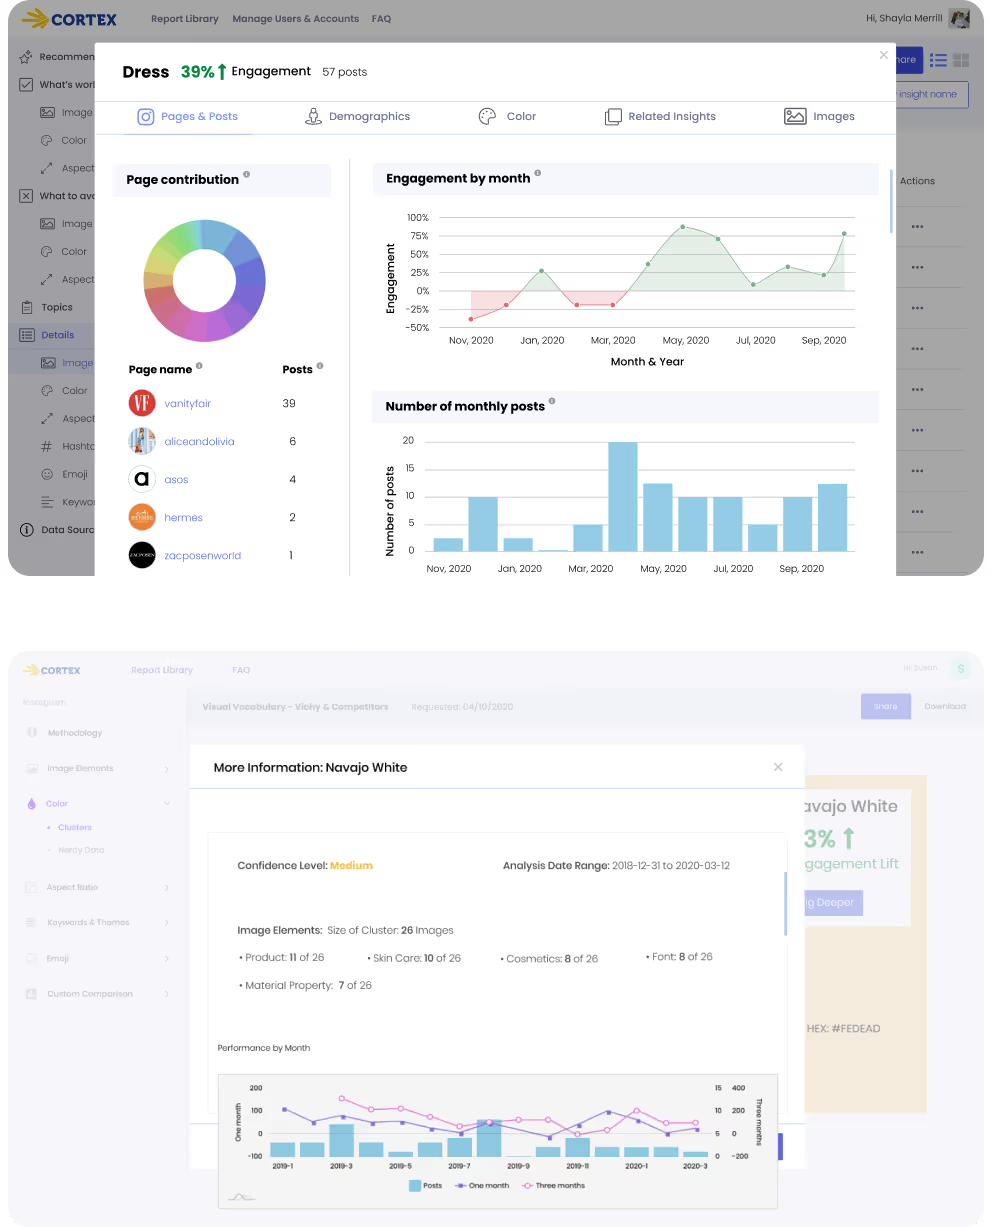
It gives you a large analysis report on how your social media posts compare to your competitor's posts.
I reimagine these data-heavy reports as a recommendation based experience that gives users actionable insights.
This will give the users a high level view into what’s working what’s not working. It will also give them ideas on how to change their social media posts to increase engagement, without having to dig into the data.
%201.avif)
We gave them too much data!
Cortex’s reports often contained hundreds, sometimes even thousands of insights, each with additional layers of supporting data.
This volume overwhelmed users and made it difficult for them to identify which insights would positively influence their work.
The lack of clarity in the reports led to frustration, increased churn, and a diminished perception of the product’s value.
Users needed a faster, more intuitive way to understand which insights mattered most and how they could apply these insights to their social content to increase audience engagement.
.avif)
I conducted user testing and interviews, with a mix of both cold and existing users. Of the 9 participants, most rarely went beyond top level data and searched for faster ways to understand insights.
6 out of 9 participants Found that there was a steep learning curve to using Cortex and understanding the data.
5 out of 9 participants Needed assistance finding data within a report, and said that it was too time consuming to go through every insight.
7 out of 9 participants Did not know how to use this data to positively influence their work.
.avif)
Our users needed a simple and easy way to understand the given data and get insights on how they could use it.
Our chosen solution is a feature called “Recommendations”
Recommendations gives data-backed, actionable insights. It is resource-intensive to implement but requires minimal upkeep and supports product–market fit.
Other solutions we came up with were: Report Walkthroughs, Tutorial Videos, and Adding tooltips, contextual descriptions, and search, sort, and filter features.
.avif)
Cortex saw an increase in customer retention and onboarding of new customers.
These new customers had less questions about the data, and how they could implement it into their workflows.
With insight into how to use the data to positively influence their audience engagement already paying customers were more willing to renew contracts.
20% Increase in monthly active users.
5% Increase for the conversion rate of free to paid customers.
Increased user satisfaction, more users were regularly coming back into the software.
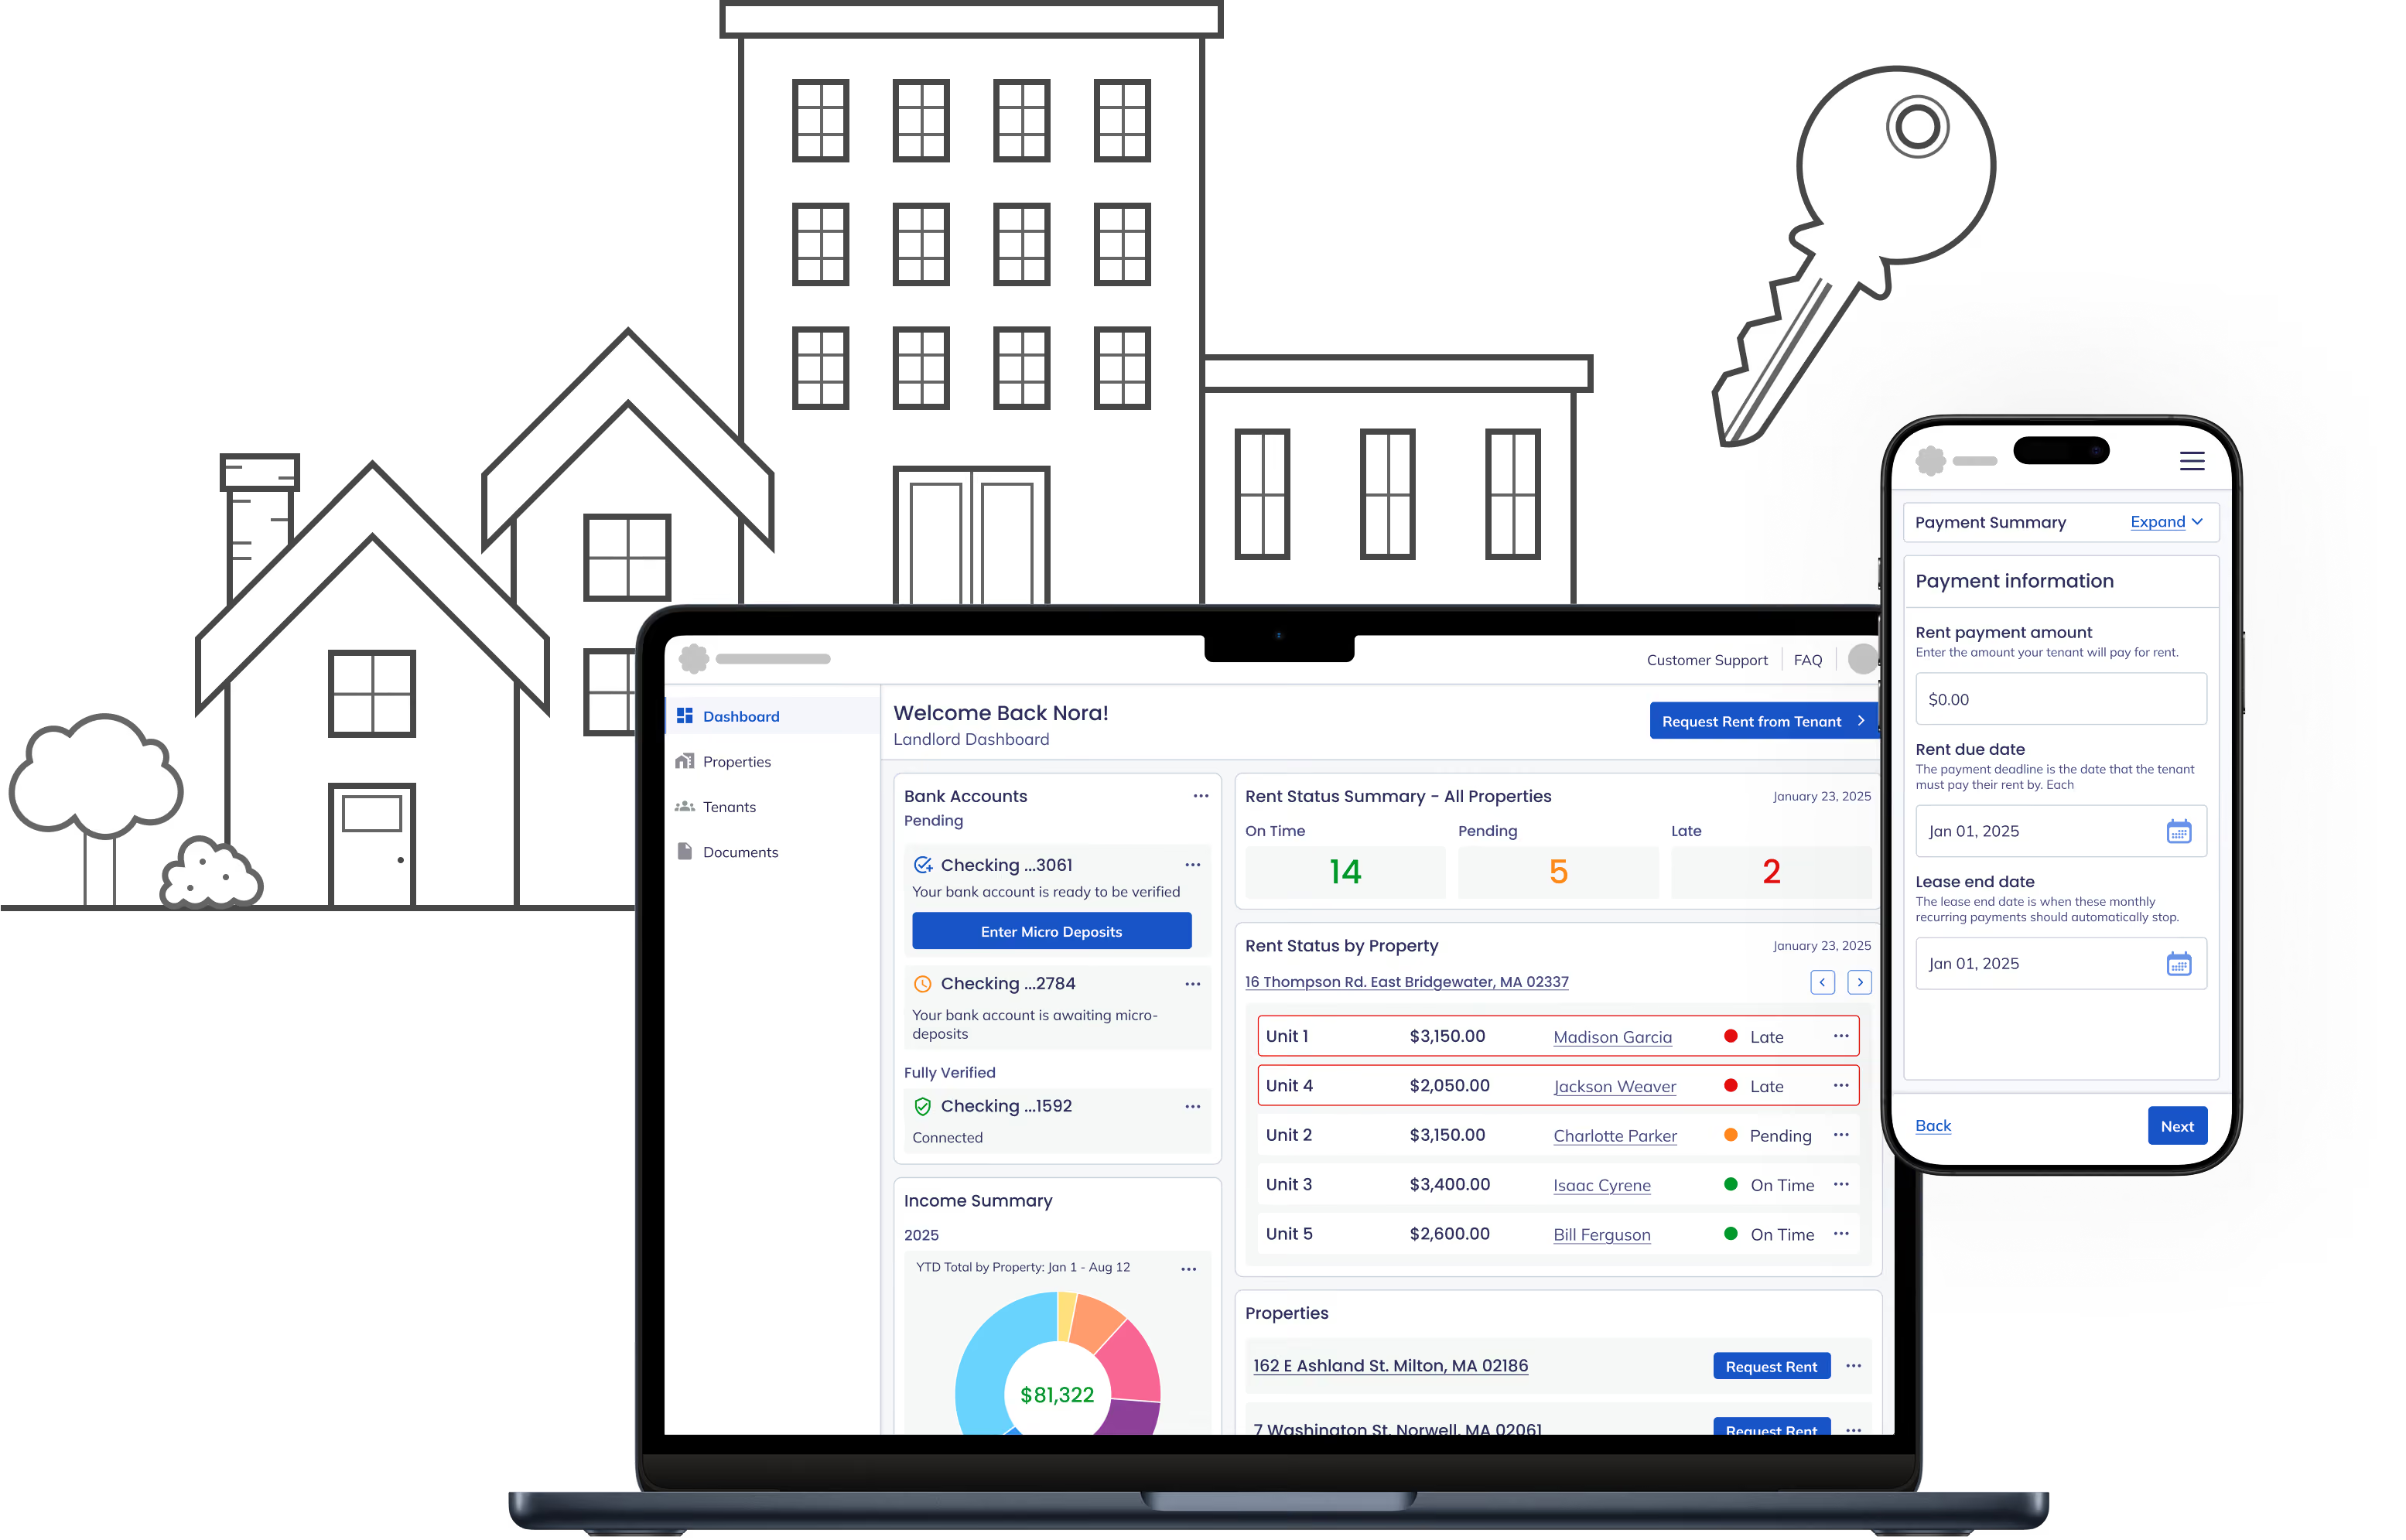
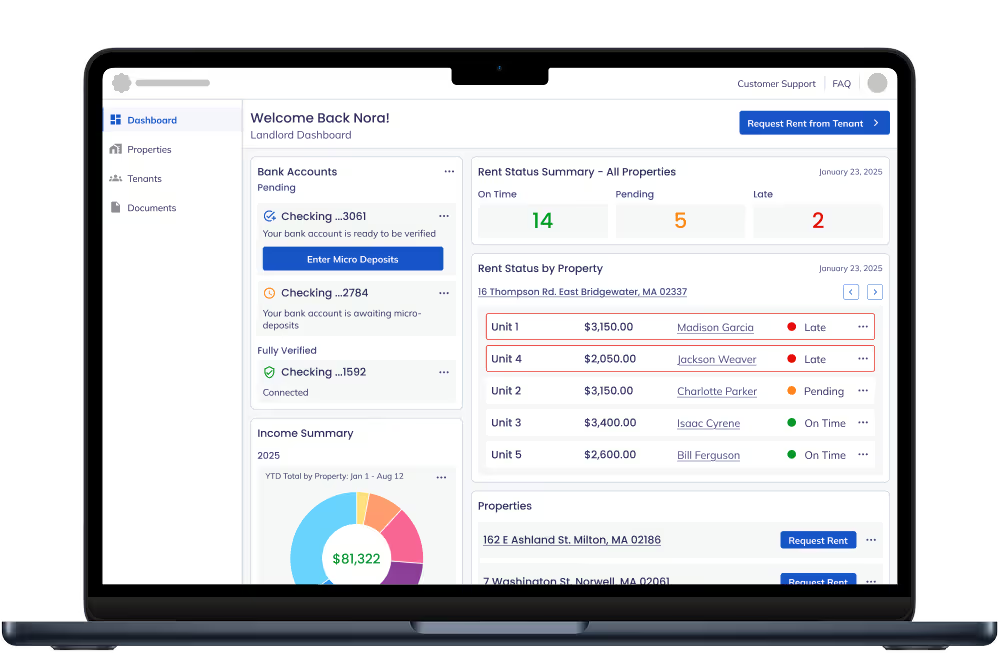
This real estate fintech platform primarily supported one-time transactions, causing users to leave after completing a payment.
To improve retention and create recurring revenue, we expanded the platform with landlord and tenant experiences centered around recurring rent collection.
The MVP included a landlord dashboard, recurring rent request flows, tenant payment workflows, and targeted adoption campaigns while leveraging the existing design system to meet an aggressive launch timeline.
We gave them too much data!
Cortex’s reports often contained hundreds, sometimes even thousands of insights, each with additional layers of supporting data.
This volume overwhelmed users and made it difficult for them to identify which insights would positively influence their work.
The lack of clarity in the reports led to frustration, increased churn, and a diminished perception of the product’s value.
Users needed a faster, more intuitive way to understand which insights mattered most and how they could apply these insights to their social content to increase audience engagement.
I conducted user testing and interviews, with a mix of both cold and existing users. Of the 9 participants, most rarely went beyond top level data and searched for faster ways to understand insights.
6 out of 9 participants Found that there was a steep learning curve to using Cortex and understanding the data.
5 out of 9 participants Needed assistance finding data within a report, and said that it was too time consuming to go through every insight.
7 out of 9 participants Did not know how to use this data to positively influence their work.
Our users needed a simple and easy way to understand the given data and get insights on how they could use it.
Our chosen solution is a feature called “Recommendations”
Recommendations gives data-backed, actionable insights. It is resource-intensive to implement but requires minimal upkeep and supports product–market fit.
Other solutions we came up with were: Report Walkthroughs, Tutorial Videos, and Adding tooltips, contextual descriptions, and search, sort, and filter features.
Cortex saw an increase in customer retention and onboarding of new customers.
These new customers had less questions about the data, and how they could implement it into their workflows.
With insight into how to use the data to positively influence their audience engagement already paying customers were more willing to renew contracts.
20% Increase in monthly active users.
5% Increase for the conversion rate of free to paid customers.
Increased user satisfaction, more users were regularly coming back into the software.
.avif)
Toast is a restaurant point of sale and management system.
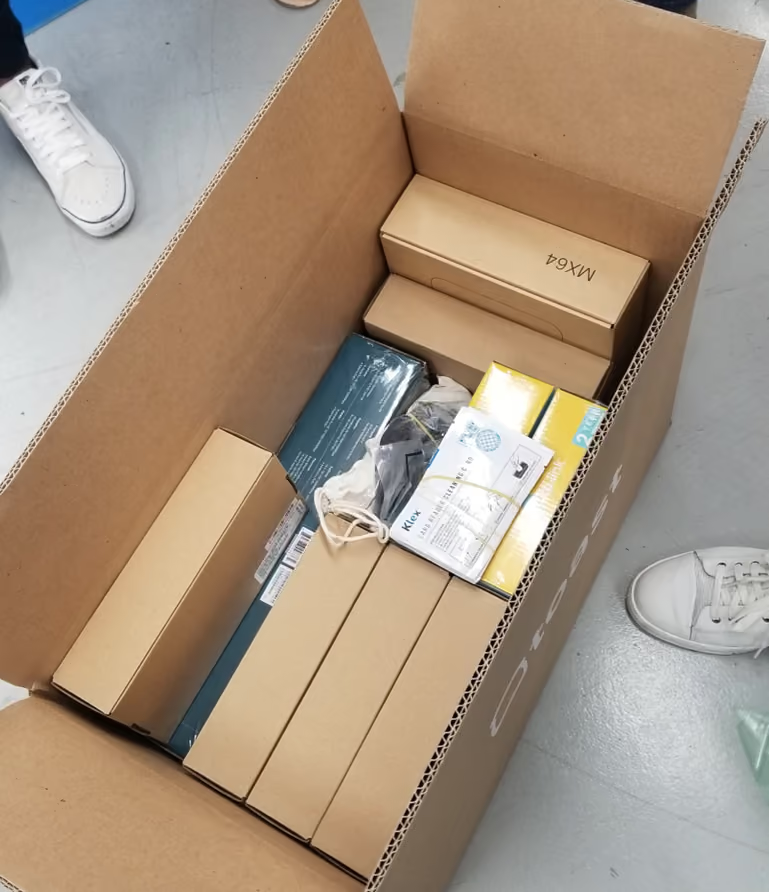
While visiting Toast's warehouse, I identified shipment organization issues caused by unmarked manufacturer boxes, miscellaneous packaging, and large orders containing over 20 hardware components.
Customers often struggled to track what they received and had a hard time knowing if anything was missing before installation day.our competitor's posts.
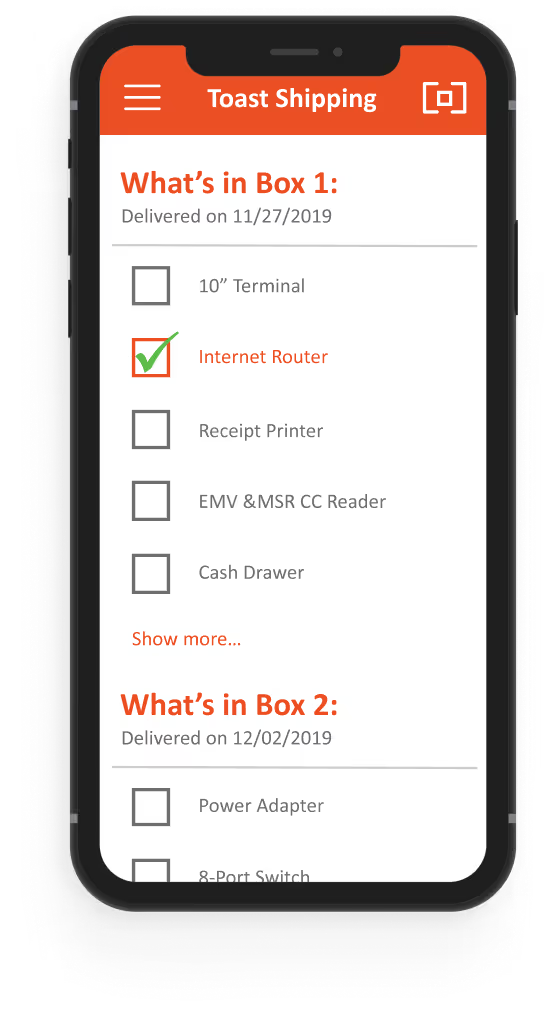
To solve this, I designed a hybrid shipment tracking system.
This system combines physical labels and paper checklists with a mobile based QR-scanning experience. This helps their wide array of customers stay organized, while also allowing Toast to have better shipment visibility and reduced support outreach.
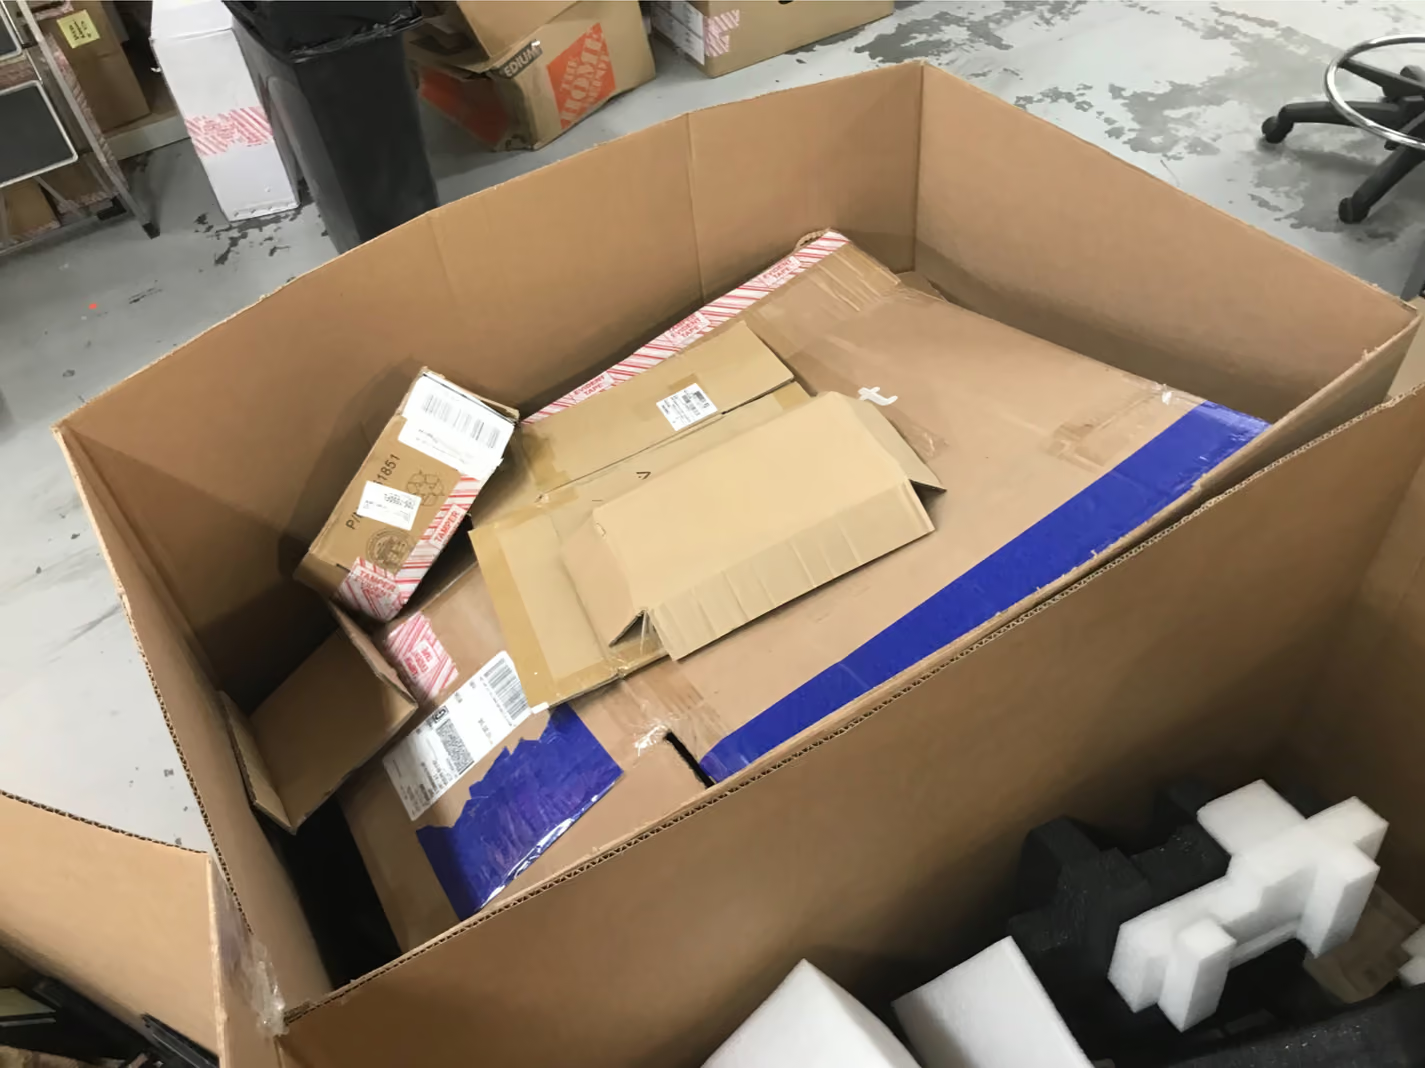
Toast customers experienced confusion and frustration when they received large shipments of hardware from the Toast warehouse.
The various unmarked manufacturer and miscellaneous boxes that were used to ship Toast's hardware lacked consistent labeling and organization.
These inconsistencies made it difficult for customers to verify that they had received every component or to identify which items belonged together.
This lead to misplaced hardware, delayed installations, replacement shipments, and increased customer support inquiries.
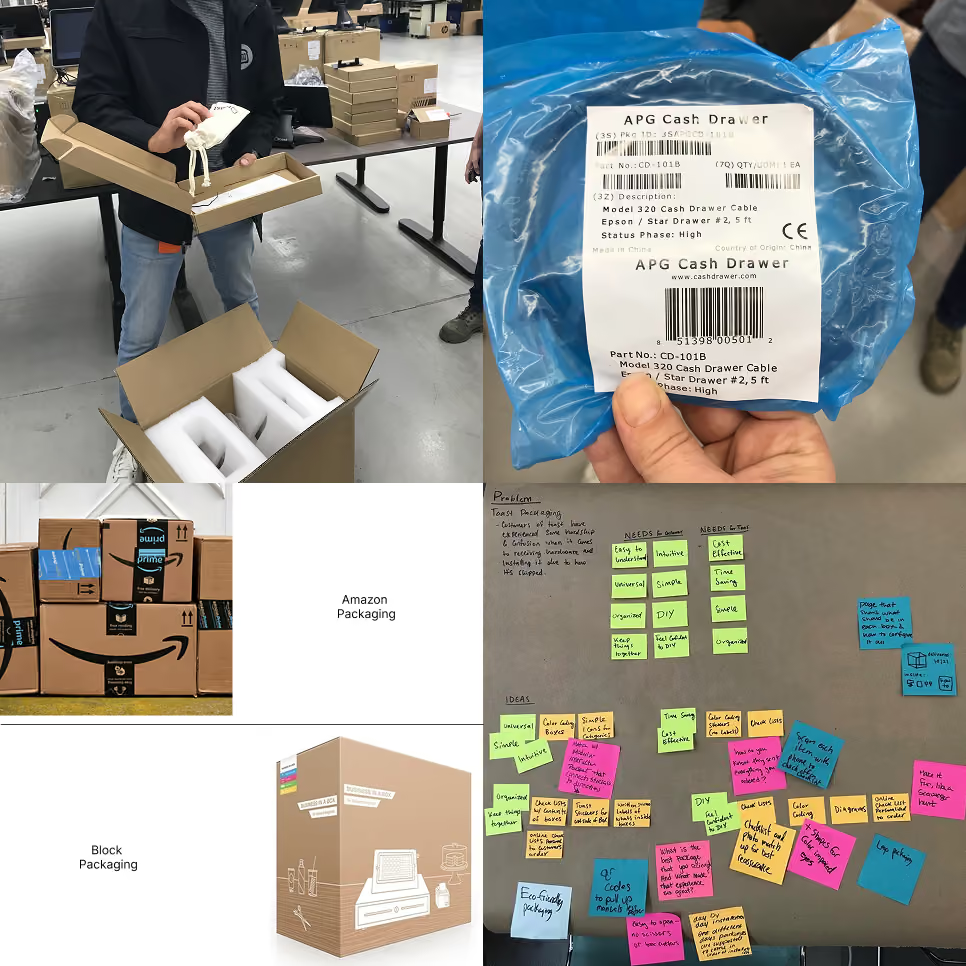
By speaking to warehouse employees and conducting competitive analysis I found the following insights.
Orders often contained 20+ components, making shipments difficult to organize and verify.
Mixed packaging made it unclear which items belonged together.
Customers struggled to track components, leading to misplaced hardware, delayed installations, and support requests.
Warehouse teams frequently sent replacements for items customers believed were missing.
Competitors like Amazon and Block used clear packaging and branding to create a more intuitive delivery experience.
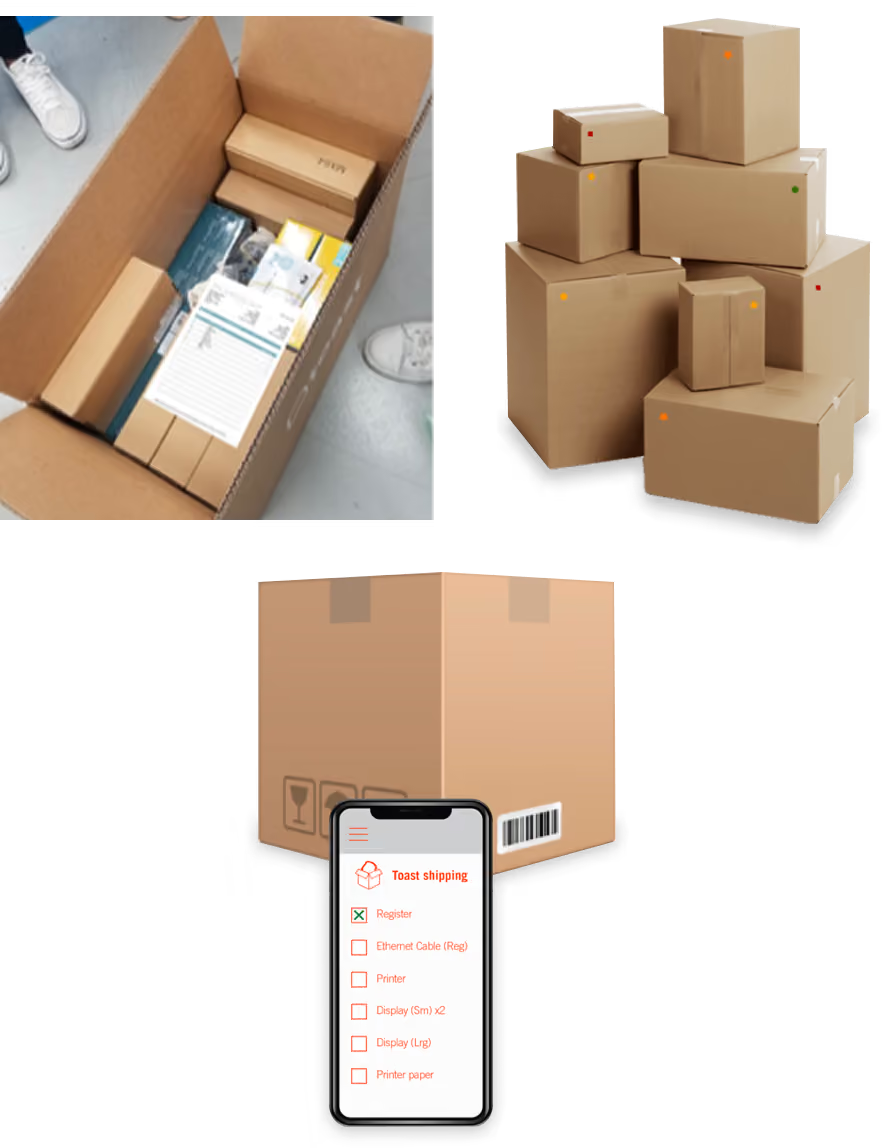
I explored solutions ranging from low-tech physical systems to a mobile tracking app, to improve shipment accuracy while balancing usability, accessibility, and implementation cost.
Early concepts included printed inventory checklists as a low-tech, low-cost solution.
Another solution was using distinct color and shape-based stickers to mark different parts of the POS system. This would help customers quickly organize their items.
To support users with varying levels of technical experience, I combined printed inventory checklists with a mobile app that used QR codes to verify shipments, track inventory, and report missing hardware in real time.
.avif)
I presented my final concept to the Head of UX Design at Toast.
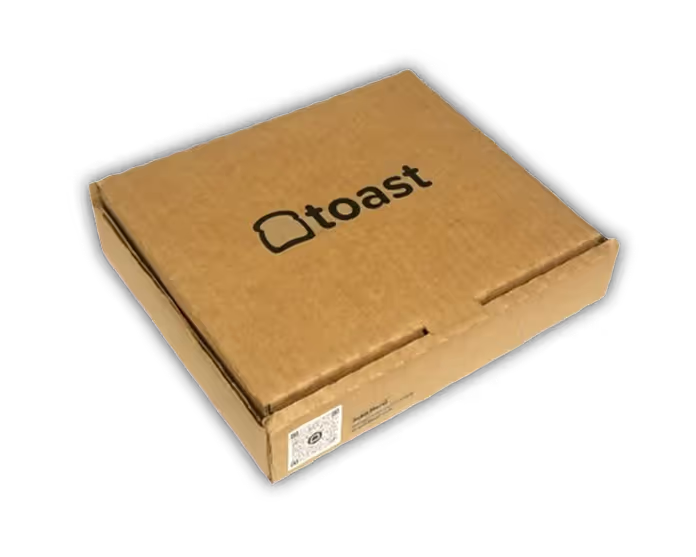
I created a physical shipment box prototype with standardized labeling and a QR code to simulate the prototyped mobile workflow. This made the concept tangible and enabled stakeholders to better understand and evaluate it through hands-on interaction.
This was the feedback I received:
Positive feedback on the printed checklist, it was viewed as a quick, low-cost, high-impact improvement that would not disrupt current warehouse operations.
Strong interest in the mobile app concept, it was well received for bridging physical shipments with digital inventory tracking.
Toast is a restaurant point of sale and management system.
It helps creatives build a stronger online presence across all major social media platforms such as: Instagram, Facebook, X/Twitter, TikTok, Youtube, LinkedIn, & Pinterest.
It gives you a large analysis report on how your social media posts compare to your competitor's posts.
I reimagine these data-heavy reports as a recommendation based experience that gives users actionable insights.
This will give the users a high level view into what’s working what’s not working. It will also give them ideas on how to change their social media posts to increase engagement, without having to dig into the data.
We gave them too much data!
Cortex’s reports often contained hundreds, sometimes even thousands of insights, each with additional layers of supporting data.
This volume overwhelmed users and made it difficult for them to identify which insights would positively influence their work.
The lack of clarity in the reports led to frustration, increased churn, and a diminished perception of the product’s value.
Users needed a faster, more intuitive way to understand which insights mattered most and how they could apply these insights to their social content to increase audience engagement.
I conducted user testing and interviews, with a mix of both cold and existing users. Of the 9 participants, most rarely went beyond top level data and searched for faster ways to understand insights.
6 out of 9 participants Found that there was a steep learning curve to using Cortex and understanding the data.
5 out of 9 participants Needed assistance finding data within a report, and said that it was too time consuming to go through every insight.
7 out of 9 participants Did not know how to use this data to positively influence their work.
Our users needed a simple and easy way to understand the given data and get insights on how they could use it.
Our chosen solution is a feature called “Recommendations”
Recommendations gives data-backed, actionable insights. It is resource-intensive to implement but requires minimal upkeep and supports product–market fit.
Other solutions we came up with were: Report Walkthroughs, Tutorial Videos, and Adding tooltips, contextual descriptions, and search, sort, and filter features.
Cortex saw an increase in customer retention and onboarding of new customers.
These new customers had less questions about the data, and how they could implement it into their workflows.
With insight into how to use the data to positively influence their audience engagement already paying customers were more willing to renew contracts.
20% Increase in monthly active users.
5% Increase for the conversion rate of free to paid customers.
Increased user satisfaction, more users were regularly coming back into the software.

An ACH-first payment platform did not support check-based payments. This prevented certain real estate customer segments from using it as their primary payment solution.
Since checks are required for some key transactions for these customers, they are forced to leave the platform to complete their payments.
Adding a mobile-first check deposit workflow to the platform would allow their agents to skip the typical manual check deposit process.
They can complete check deposits in real time within the platform during in-person transactions, such as home closings, without breaking their workflow.
This addition improved efficiency, reduced fragmented workflows for agents, and expanded adoption by creating support for previously excluded customer segments.
We gave them too much data!
Cortex’s reports often contained hundreds, sometimes even thousands of insights, each with additional layers of supporting data.
This volume overwhelmed users and made it difficult for them to identify which insights would positively influence their work.
The lack of clarity in the reports led to frustration, increased churn, and a diminished perception of the product’s value.
Users needed a faster, more intuitive way to understand which insights mattered most and how they could apply these insights to their social content to increase audience engagement.
I conducted user testing and interviews, with a mix of both cold and existing users. Of the 9 participants, most rarely went beyond top level data and searched for faster ways to understand insights.
6 out of 9 participants Found that there was a steep learning curve to using Cortex and understanding the data.
5 out of 9 participants Needed assistance finding data within a report, and said that it was too time consuming to go through every insight.
7 out of 9 participants Did not know how to use this data to positively influence their work.
Our users needed a simple and easy way to understand the given data and get insights on how they could use it.
Our chosen solution is a feature called “Recommendations”
Recommendations gives data-backed, actionable insights. It is resource-intensive to implement but requires minimal upkeep and supports product–market fit.
Other solutions we came up with were: Report Walkthroughs, Tutorial Videos, and Adding tooltips, contextual descriptions, and search, sort, and filter features.
Cortex saw an increase in customer retention and onboarding of new customers.
These new customers had less questions about the data, and how they could implement it into their workflows.
With insight into how to use the data to positively influence their audience engagement already paying customers were more willing to renew contracts.
20% Increase in monthly active users.
5% Increase for the conversion rate of free to paid customers.
Increased user satisfaction, more users were regularly coming back into the software.